Executive Summary
A common job
for those in consumer marketing/brand management is to analyze large amounts of
scanner data from companies such as IRI and AC Nielsen. “Scanner data” is
defined as the information collected each time a product stock keeping unit
(SKU) is “scanned” in a retail establishment. Scan data reports contain information
such as a SKU’s price, whether it was sold on a promotion, and the average
number of items sold for a particular brand. It can be at the detailed SKU
specific level or as high as the brand and retailer level.
This data
comes in a large csv or Excel dump from these providers and is difficult to
analyze because there is no industry-wide, uniform data format. This is because
each and every brand has its own unique time frames, metrics, and reoccurring formats
to compare itself against; thus, there is no single web-based or VBA solution to
analyze its data dump. All the data providers can do is provide raw data.
Often, companies will spend thousands of dollars trying to develop an Excel model
that will allow them to quickly and repeatedly understand scanner data for their
brand.
There is,
however, a certain methodology that many brands use when making sense of their
data. Figure 1 provides is a schematic of that methodology.
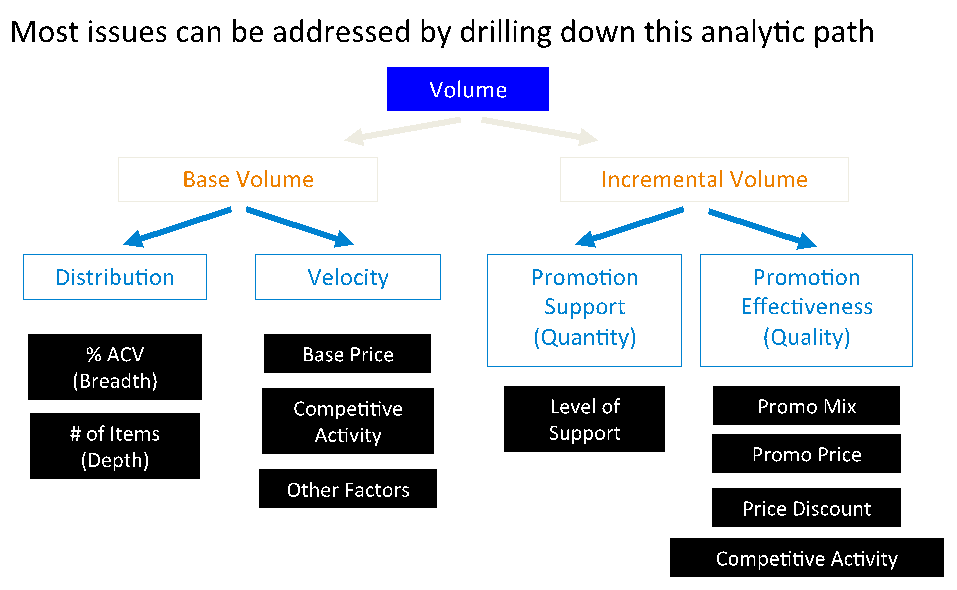 |
| Figure 1: Scanner Data Analysis Methodology. Credit: Mike Bond, Brand Management Professor |
For this
project a large amount of my time was spent understanding how a brand manager
thinks and the process they go through to asses a business situation facing his
or her brand. To clearly understand this I met with Mike Bond, the Marriott
School’s Brand Management Professor and former Sr. Brand Manager at ConAgra
Foods, to discuss this process. Here is a summary of how the process works (see
Figure 1): The way a brand manager recognizes a business problem with his or
her brand is by first looking for a change in a brand’s volume. Once the
manager notices a change in volume, the next question is what is driving those
changes in volume. The manager will then look at the volume spilt between base
(when the brand’s product is sold at regular volume) and incremental (when the
brand’s product is sold at a discount). From there a manager would need to
consider driver or changes in base and incremental volume. He or she would do
this by considering the next level in the chain described in Figure 1. Note
that the black boxes are all individual drivers of the of the driver listed
above them (e.g., %ACV and Average # of items are drivers of distribution,
which in turn is a driver of base volume, which is a driver of total volume).
I developed
a VBA model that will use the above methodology to analyze scanner data for a
specific category. The scanner data used in the project is real data, but the
category name and brands have been masked. The model will allow the user to
select his or her brand and it will compare the selected brand against itself 1
year ago as well as against the category. Additionally, as this is a task that
is done on a weekly basis, I developed a data import system that allows the
user to select a folder where reports will be automatically downloaded to and that
opens and imports the data from the latest uploaded Excel file. This assumes
that the data reports are uniform for this brand, which is how it would be in
the actual company where it would be used. Were someone to take this model and
try and connect it to a different brand category, he or she would need to “rewire”
the model to work for the specific data organization of that category pull, but
typically, once the data report is developed it will be uniform week to week.
The model
also provides some protection and clean-up methods that allow the user to
interact cleanly with the generated worksheets in the model, thus creating a
better user experience. The model boasts clean and well organized ribbon
controls to further enhance the user experience. Finally, it automatically
creates charts to allow a brand manager to quickly visualize brand performance and
it allows the brand manager to select competing brand and compute category wide
performance among the selected brands.
The ultimate
goal of this project is to allow brand managers to quickly and effectively make
decisions based on the data, and spend less time trying to wrestle insights out
of it.
The actual Excel file will not be posted here due to data sensitivity.
Logan Dunn
The actual Excel file will not be posted here due to data sensitivity.
Logan Dunn
No comments:
Post a Comment