For work I have to generate a monthly report on multiple websites that provides information such as the number of visits on the site for the last month, how many pages a visitor visited, and which were the top pages. This information and more is gathered automatically on our websites through a free service provided by Google which is called Google Analytics. To generate the monthly reports I would generally run a series of reports using the Google Analytics website and then I would format the reports and extrapolate customized data based on the current and historic records of website traffic. In all this monthly report would take me about and hour, but because I was doing it by hand, chances for error with the data was high.
This project was aimed at automating the monthly web reports in order to free up my schedule. This was done by acquiring VBA code that interfaced with the Google Analytics Application Programming Interface (API). This code essentially would allow me to run Google Analytics reports through Excel instead of through the Google Analytics web interface. Once I was able to access the data from Google, the resultant data had to be processed and then formatted so that it would provide the same monthly web report that I had previously been giving.
The result of this project was an Excel macro that would work on any Google Analytics account and provide these same reports in a matter of minutes as opposed to an hour or more.
Files:
Folder Directory: http://gove.net/courses/excel/projects/JSpeirs/
Excel File: http://gove.net/courses/excel/projects/JSpeirs/GA_Report_Runner.xlsm
Write Up (PDF): http://gove.net/courses/excel/projects/JSpeirs/Writeup.pdf
Implementation Documentation:
There are three parts to this problem. The first part is accessing the Google Analytics database, the second is in parsing and summarizing the retrieved data, and the third is in providing an interface for a user to run the reports from.
To access Google Analytics, Google has provided an API with instructions on how to retrieve data from their analytics database. Libraries were provided by Google for various languages, most of which were web based languages. Initially I thought I would create a web page that provided the data I was looking for in my reports and that I would then use Excel to load that web page and then read its contents. This idea worked, but the problem was that it took an unacceptable amount of time to run each report. With more research I was able to find a library created for Excel that tapped into the Google Analytics API directly. This code can be downloaded from http://mikaelspage.blogspot.com/2009/08/excel-functions-for-fetching-data.html or alternatively these same macros can be found encapsulated in the class "Analytics" within the project workbook I created. I created the "Analytics" class so that it would be easier to manage the interactions with Google Analytics within my own code. Using this code I could get the Google Analytics data I needed by telling Google Analytics what type of information I was requesting. I used a website from Google called the Google Analytics Query Explorer (http://code.google.com/apis/analytics/docs/gdata/gdataExplorer.html) to help me understand how to correctly make a request.
At this point I was able to access the data manually, but I wanted to allow it to retrieve data from many reports. In response to this I wrote two classes. The first class, "Profiles" allowed me to load a list of all the profiles associated with the user's log in and password. It could also retrieve the profile id numbers for each profile which was essential when it came to actually running the reports. The second class was much larger and was titled "Profile". This class would take the profile id number, and make a series of requests for Google Analytics data, using the "Analytics" class mentioned above. Once all of the data was retrieved the "Profile" class would use other sub procedures and functions it contained to read through the data and organize it, and then finally it would put the data out onto the main Reports worksheet. I took the time to format the final report for each report run so that a single report would take exactly one printed page. In the case that multiple reports were run sequentially and outputted to a single Report worksheet, then each sequential report would go onto the next available printed page.
With the first two steps complete it came time to design an interface where a user could run the report. The first essential part was to require that the user log in using their Google Analytics account email and password. The reason for that was that the list of possible websites to run the reports on could not be populated without knowing what the user's authentication information. Figure 1 below shows the log in form.
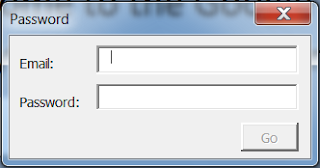
Figure 1: Google Analytics Login Form
Once the user logged in, if the log in was successful, then a second form would appear with a list of the possible websites/profiles for reports that could be run. This list of websites/profiles was retrieved from the Google Analytics database based on the authentication information provided.
 Figure 2: Report Selection Form
As can be seen in Figure 2 above, there is a list of all possible reports that can be run based on the user's log in information. There is also a box where a user can select to load from one to six months of history in each selected report. Once the user has selected one or more reports the "Run Report(s)" button is enabled and the reports can begin to populate. Once the reports are populated all forms would disappear and the Reports worksheet would be visible.
The final touches on the program included making the log in window appear once the user opened the Excel workbook and then cleaning up all of the information that was generated when the report was run once the user closed the workbook. This insured that the next time a user opened the Excel file that it would be blank so that the previously run report's data would remain confidential.
Difficulties and What I Learned:
The biggest difficulty that I encountered on this project was getting the data out of Google's databases and into my Excel project. As previously explained, I attempted to have Excel load a web page which would generate the reports data, but unfortunately this took too long to complete. I researched more and was able to find a set of Excel macros that made it much faster and easier to retrieve the Google Analytics data. I learned from this that importing macros from previously established VBA code can save a lot of time and I also learned that there is a lot of VBA code on the web that can be used for general purposes.
Another difficulty I experienced was in building the charts to display total page views per date. This was difficult because I had a hard time getting the charts to consistently be in the right place and to have the right width and height. I was able to resolve this issue when I discovered that a range object contains a Top and Left position as well as a Width and Height. I could then use the cell positions (which were always the same relative to the report) to determine where the chart should go.
A third difficulty that I had came from manipulating dates. I found myself redundantly writing code to get calculated dates. To fix this I wrote a class I called "DateManipulator" which would do a lot of things with dates for me. This made it so that I could simplify my code when it came to using dates because I had a class created that would do all the work for me. I learned from this the value of structuring my code. It was when I learned this lesson that I really began to make progress on this project.
No comments:
Post a Comment